Understanding Cloud Metrics – what to monitor and why
Tajana Belina
10 November 2021

The cloud operating model represents a huge opportunity for cost savings when compared to conventional physical computing resources. However, migrating to the cloud is a first step and not a magic wand. The path to cloud migrations is strewn with cases of organizations that have experienced cost overruns and lower than expected ROI.
Cost savings and ROI can be realized over a period by monitoring and managing cloud operations and continually optimising the deployment of cloud resources.
Monitoring Cloud Operations
It has been quite truly said
“What’s measured improves”
― Peter Drucker
In order to measure and monitor cloud operations, we first need to:
- Define the right cloud metrics
- Put in place the process to capture the metrics.
What exactly is a cloud metric?
A cloud metric is two things.
- The aspect of the device we need to measure
- The actual quantitative measure of that aspect at a specific point in time and gathered at a regular interval.
For example, CPU Utilization – 30%.
The metric aspect is CPU Utilization, and the quantitative measure is 30%. This metric may be collected at a 60 second interval as a high-resolution metric or at 5 a minute interval as a low-resolution metric.
The operative phrase here is operational visibility. Metrics provide visibility and discovery that makes it possible to monitor cloud operations.
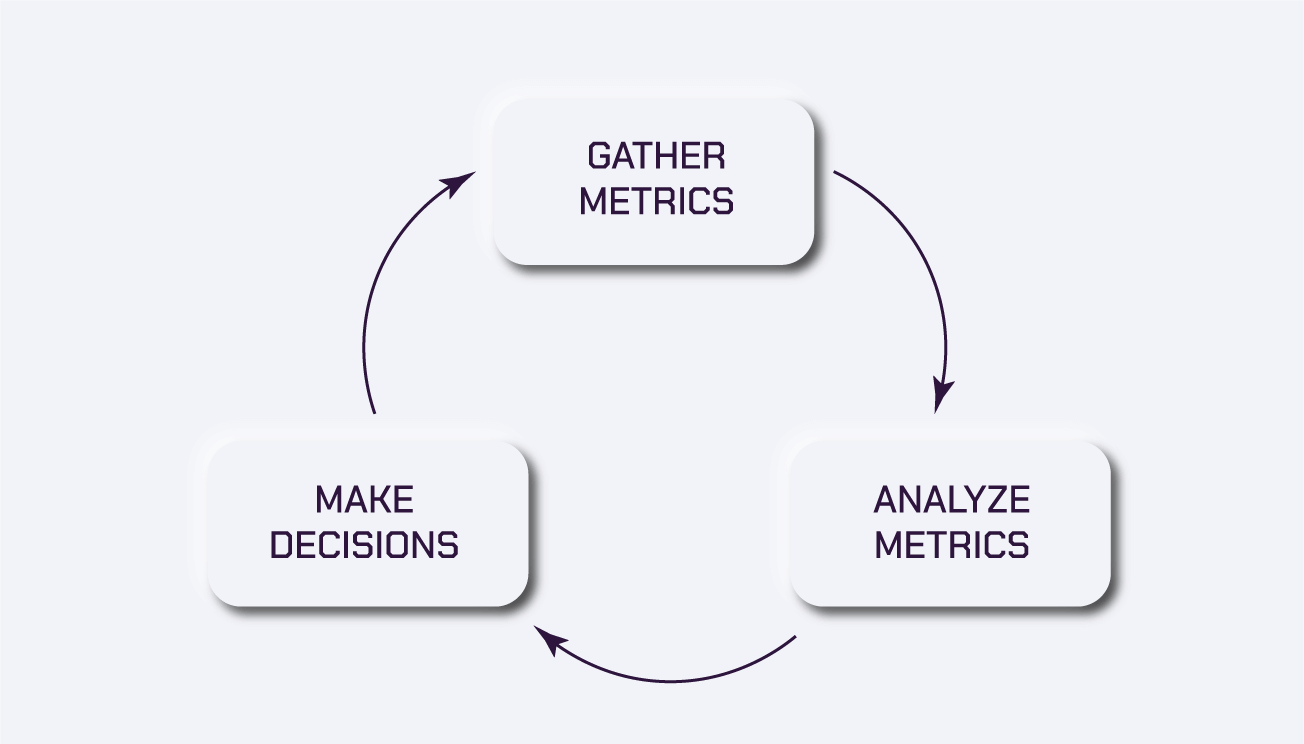
Monitoring Cloud operations is a continuous process that constitutes of:
- Aggregation of metrics
- Analysis of metrics
- Managing and configuring cloud resources and software licenses based on the analysis.

Objectives and goals of Cloud Monitoring
The right metrics, captured at the right time and with the right analysis and deductions provide insights that help in the following areas of cloud operations:
- Continuous optimisation of compute resources in terms of idle or oversized resources
- Optimising software license renewal and acquisition
- Identifying and pre-empting Security vulnerabilities
- Identifying performance related issues
The first two objectives listed above can influence costs directly. There is no way to quantify security vulnerabilities in terms of costs on a predictive basis. However, the overall costs of security failures can be very expensive. Similarly, performance issues can result in deficiencies of service and there is no way to directly quantify this in terms of costs.
The end goals of cloud monitoring are:
- eliminating waste in terms of
- rightsizing oversized resources such disk volumes, virtual machines, database or PAAS based artefacts and services.
deleting idle resources such as disk volumes, or compute instances.
over licensed software applications.
- identifying potential security risks
- improving service delivery and increasing customer satisfaction by improving performance
- cost reduction
Let’s face it. In a typical cloud environment, it is possible to have idle or orphaned resources that are adding to the cloud bill. Teams and engineers create resources and forget about the resources. Disk volumes are backed up and sometimes not used nor required.
Unnecessarily scaling resources such as production servers, horizontally upwards, results in provisioning a greater capacity than is required and increase in costs.
This is where FinOps comes in. With its emphasis on cross department collaboration and metric driven cost optimisation (MDCO), it plays an invaluable role in bringing out financial discipline in cloud operations.
FinOps works by using a twin pronged approach to reduce costs by:
- Adopting the best practices for discount-based and cost-effective procurement of cloud services
- Setting up internal operational control and resource optimisation workflows based on metrics.
Read more about FinOps from our blog here.
How are metrics generated?
Let’s take a quick look at the sources from where cloud metrics are generated.
Metrics generated by cloud services
All resources created within a cloud service will provide a set of default standardized metrics automatically. These metrics are usually collected by another cloud service that works as an aggregator. This service provides functions to filter, visualize, report upon, configure and manage the metrics.
Examples of the aggregator services are Monitor for Azure and CloudWatch for AWS
Metrics generated by agent installed on virtual machine
Metrics related to virtual servers and applications running on the servers can be collected only by installing software applications or agents, which are installed on the virtual servers. Since such metrics are closely coupled with the virtual machine instance, these can be captured only by using agent software.
Custom Metrics
Custom metrics are metrics that the user can create depending upon requirements. These can be created from within the agent installed on the virtual machine. An example in point would be creating a metric that records the number of connection requests to a port on a compute instance.
Metrics created from logs
Metrics and logs are two different forms of instrumentation. It is however possible to use filters in logs that return the number of occurrences of a pattern within the logs as a metric.
An example would be the number of 404 status codes within a web server log, returned as a metric.
What sort of metrics do we capture?
“If you don’t collect any metrics, you’re flying blind. If you collect and focus on too many, they may be obstructing your field of view.” ― Scott M. Graffius, Agile Scrum: Your Quick Start Guide with Step-by-Step Instructions
There are a number of predefined metrics provided by each cloud service provider. It can often be confusing when we want to match a metric for a particular purpose.
Besides the predefined metrics, cloud platforms provide an ecosystem to create and publish custom metrics based on the requirement.
Metrics – Classified by Function
Broadly speaking, metrics provide information that is critical for the following functions:
- Terminating redundant cloud resources
- Discovering opportunities for rightsizing resource configuration
- Isolating application performance issues
- Preemptively identifying security risks
1. Terminating redundant cloud resources
By using metrics, it is possible to determine resources that have been left around or are orphaned and unutilized.
Virtual machines and block storage volumes are both resource types that may be in an unutilized state and therefore contributing unnecessarily to costs.
Virtual machines are provisioned and often not accounted for. Block storage volumes are often unutilized as these are retained when the parent Virtual Machine is terminated.
Block Storage Volumes can be:
- unattached and therefore not required OR
- attached but unused and possibly not required.
Inbuilt metrics such as VolumeIdleTime are especially useful in determining whether an attached volume is relatively unused.
2. Discovering opportunities for resource configuration
Metrics return information based on which we can decide to upscale, downscale, or reconfigure cloud infrastructure resources.
Resource configuration works in two ways. If metrics reveal that a resource is possibly oversized, it can be resized downwards or downscaled. On the other hand, metrics may reveal that resources need to be resized upwards or upscaled. In the first case there will be a cost savings, whereas in the second case there will be a likely increase in costs.
This reminds us of the fact that FinOps is not just about cost reduction. It is about getting the right size resources at an optimum cost.
Object storage, virtual machines, networks, and block storage are some of the cloud resource types that often need to be rightsized – either upscaled or downscaled.
3. Isolating application performance issues (DevOps)
Applications running on your virtual machines may face performance issues or bottlenecks. These issues could be related to application request or response errors, disk I/O, high latency, or high response time.
Such performance issues can point to either of the two following reasons:
- Poor Application Design
- Under configured disk volumes, compute instances or network bandwidth
Applications are increasingly being designed using complex microservice architecture and hosted using containerization. As a result, capturing the relevant metrics related to application performance assumes an even greater role as we need to determine whether it is application design or resource constraints that are causing poor application performance.
4. Preemptively identifying security risks
Outcomes from the first two functions above have a direct bearing on costs. The third one may have a direct relationship with costs. But there is no quantifiable benefit of identifying a potential security risk using metrics. However, the cost savings cannot be quantified as security incidents, and that could be catastrophic.
A possible application of metrics could be to determine if there is any spike in the number of requests to a particular port number. This could help in isolating potential DDOS (distributed denial of service) attacks.
Besides classifying metrics according to function, let’s also take a look at metrics classified according to device or resource types. Let’s look at possible classifications according to service or resource type with a few examples of each metrics within the service.
Metrics – Classified by Device or Resource Type
Block Storage (Disk) Volume Metrics
Examples of such metrics are
- Volume Queue Length (AWS)
- Volume Queue Depth (Azure)
- Disk Reads per Second
- Disk Writes Per second
Virtual Machines Metrics
Examples of such metrics are
- CPU Utilization
- CPU Time Active
- Network In
- Network Out
Object Storage Metrics
Examples of such metrics are
- Bucket Size Bytes
- Number Of Objects
- Get Requests
- Put Requests
Cost Optimisation happens in the long run
With its nimble footprint, the cloud is undoubtedly an exciting avenue for creating testbeds to validate proof of concepts and prototypes, in the short run.
- Use the cloud to build strengths in competitive strategy, business continuity, disaster recovery and security.
- Reap the benefits of cost reduction and obtain a favourable ROI.
Optimizing cloud usage and reducing costs is based on taking the right decisions within an operational framework.
FinOps and Metrics Go Hand-in-Hand
That framework is FinOps. It binds teams together with common goals, promotes effective communication and collaboration.
Within this framework, metrics and logs provide the data to analyse and make timely and effective decisions.
We offer a range of consulting services and can partner with you to build strengths in monitoring your multi cloud operations.
To tell us more about your areas of interest, get in touch with us today.


