Debugging in Oracle SQL sucks – unless you do this
Antun Sabatovic, Consultant, Data & Analytics
13 November 2025
Debugging in SQL sometimes feels like trying to find a needle in a haystack… while blindfolded. If you’ve ever spent hours trying to figure out why your code isn’t working, you’re not alone. This guide will help you debug smarter, faster and with a lot less frustration.
Interactive debugging with SQL Developer
Oracle SQL Developer comes with a built-in debugger that lets you analyze SQL code line by line, set breakpoints and inspect variable values all without adding any extra logging to your code. It gives you full visibility into how your code executes and where things might be going wrong.
You can pause execution, see the current values of variables, and even change them mid-run to test different scenarios. This is especially useful when working with complex business logic, deeply nested procedures or packaged code.
Whether you’re troubleshooting a multi-step transformation or trying to understand a branching logic path, the debugger helps reduce guesswork and speeds up the process.
Trace errors with proper exception handling
Handling exceptions properly is one of the most reliable ways to track down bugs in SQL — especially when they’re hiding deep in your logic. With tools like SQLERRM, SQLCODE and DBMS_UTILITY.FORMAT_ERROR_BACKTRACE, you’re not just logging the error message, but also the exact line where things went sideways.
This is a huge help when you’re dealing with nested procedures, dynamic SQL or when something breaks somewhere, but you’re not sure where.
Here’s an example that shows how to catch errors the smart way:
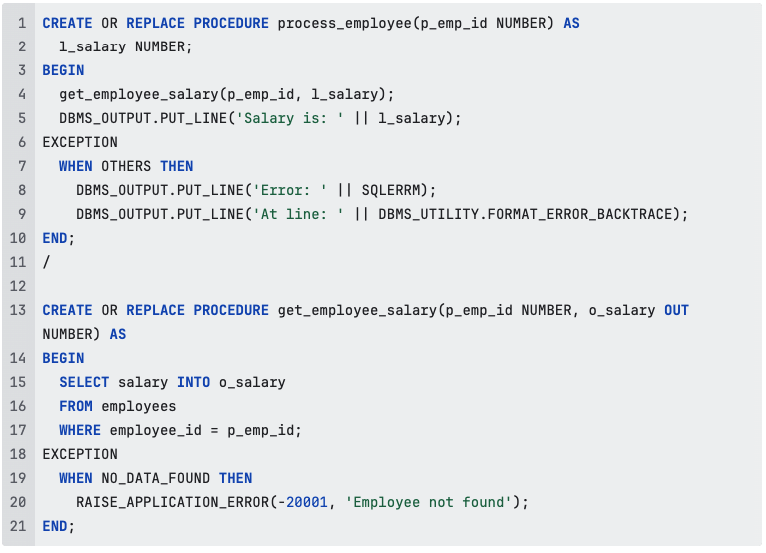
In this setup, if an error happens deep inside get_employee_salary, we can still catch and trace it from the top-level procedure using FORMAT_ERROR_BACKTRACE. This makes debugging in nested or modular code much easier.
So, whenever you’re writing code that might fail (and let’s be honest, most of it eventually does), make sure you’ve got proper exception handling in place. You’ll be grateful when something breaks at 2AM and the logs actually tell you what went wrong, where, and why. Especially in larger processes like ETL jobs, having clear error traces makes debugging way easier and helps you avoid chasing silent failures in the dark.
Log everything with custom tables
Logging to a custom database table is a practical way to capture what’s happening in your code, especially in production, where you can’t rely on the debugger or DBMS_OUTPUT. You can log error messages, variable values and timestamps to build a permanent history of events.
It’s a great fit for batch jobs, scheduled processes or anything that runs without direct supervision.
In larger systems, this logic is often wrapped in a reusable package, for example, a logger_pkg that logs messages, collections of steps or full error traces using FORMAT_ERROR_BACKTRACE. It keeps logging consistent and avoids repeating the same logic all over your code.
And one small heads-up, if your logging is frequent, especially in high-demanding systems, make sure you’ve got some kind of log rotation or archiving in place. That table can grow faster than you expect and nobody likes debugging performance issues caused by the debug logs themselves.
Use DBMS_OUTPUT for quick checks
Almost every PL/SQL developer has used DBMS_OUTPUT.PUT_LINE at some point. It’s fast, simple, and great for quick checks during development. Whether you’re printing a variable’s value or checking which branch of an IF ran, it does the job.

But it comes with limitations. The output isn’t persistent, it won’t tell you exactly where an error occurred, and if you overuse it, it can make your code harder to read and maintain.
It’s best reserved for light, ad hoc debugging, not for complex logic or production environments.
Conclusion
Understanding what’s going on in your PL/SQL code isn’t always straightforward but it doesn’t have to be painful either. With the right combination of tools, debugging can go from frustrating guesswork to a structured, confident process.
Use the SQL Developer Debugger when you need to walk through logic step by step. Add proper exception handling to catch issues where they actually happen, not five levels later. And for anything running behind the scenes, logging to tables gives you a clear audit trail you can count on. Even DBMS_OUTPUT.PUT_LINE still has a role, just know when to use it and when it’s time to reach for something more powerful.
No single technique will cover everything, but together, they give you control, clarity and peace of mind. Debugging doesn’t have to slow you down. If done right, it helps you move faster with fewer surprises.
Related articles

The turning point in my Python journey: discovering Black, Ruff and mypy
June 24, 2026

Not all discount-bearing commitments follow the same model
April 21, 2026

MATCH_RECOGNIZE: A better way to detect patterns in your data
March 17, 2026
%HEADING%
%INTRO%